What is market rotation? Money moving between sectors, styles and sizes
By Maya Koeva · September 21, 2026 · 8 min read
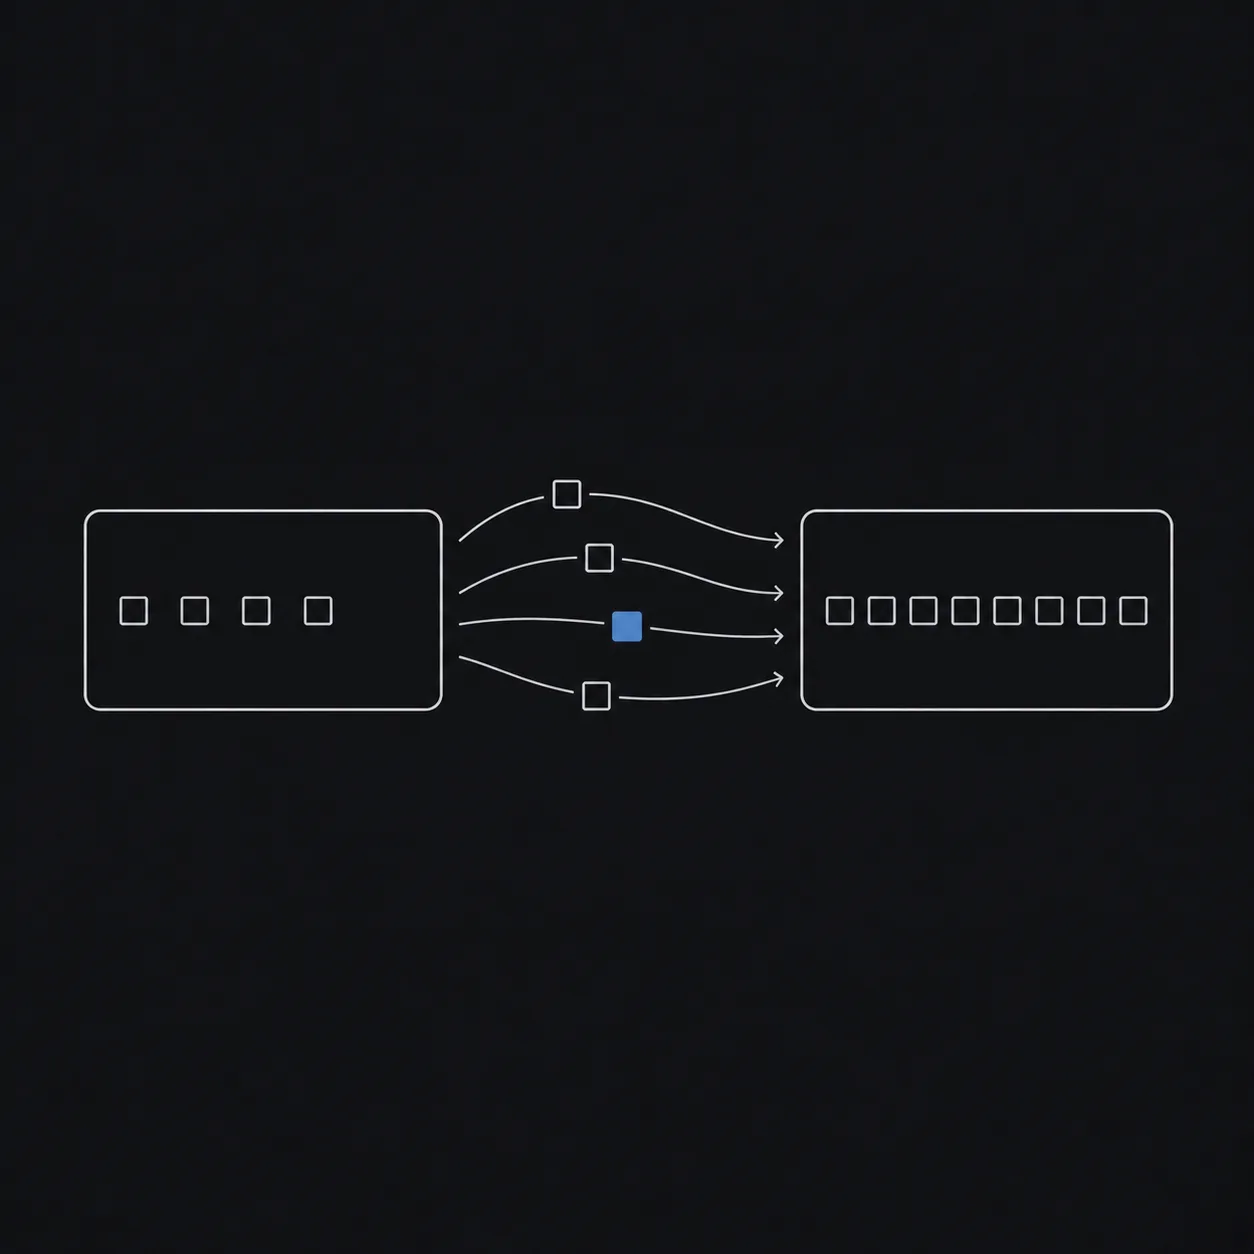
Market rotation is money moving from one part of the stock market to another without leaving the market. Investors sell one group of stocks, chipmakers or banks or small companies, and buy another, so leadership changes hands while the index itself may barely move. Stock market rotation is the same term, and sector rotation is the version where the groups are industry sectors.
In a correction most things fall together. In a rotation the money stays in stocks and one group's losses pay for another group's gains, so the index can finish a week flat with half of its members down and half up.
If you hold for years, that is seldom a reason to trade. It is a reason to check whether the story you own changed or only the attention did, and for a week or two you cannot tell those apart from the price alone.
What moves in a rotation
Rotation happens at four sizes, from the whole market down to the inside of one theme.
| Kind of rotation | What moves | What it looks like |
|---|---|---|
| Sector rotation | Money between industry sectors, cyclical to defensive and back | Industrials and consumer discretionary lag while utilities, staples and health care lead |
| Style rotation | Growth against value | Expensive fast growers lag while cheaper, slower companies lead, or the reverse |
| Size rotation | The largest companies against the smallest | An index carried by a handful of mega caps, then a stretch where small caps do the leading |
| Narrative rotation | Names inside one theme, as the bottleneck moves | Inside AI infrastructure: the GPU makers, then the memory suppliers, then power and cooling |
The first three come from the textbooks, and analysts measure them in fund flows. The fourth moves faster and turns up most in the conversation we track, because the people following a theme argue about which part of it is scarce this quarter months before flow data says anything. What is AI infrastructure lays out the layers that particular rotation runs between.
Sector rotation and the business cycle
The standard account of sector rotation ties it to the economy. Sam Stovall set the template in Standard & Poor's Guide to Sector Investing in 1996, matching sectors to phases of the economic and market cycle, and Fidelity has published a business-cycle version of the same idea for years (Fidelity). Both sort sectors by the phase they have tended to lead in:
| Phase of the cycle | Sectors the model puts in front |
|---|---|
| Early, coming out of a downturn | Consumer discretionary, financials, industrials, real estate |
| Mid, growth running | Information technology, industrials, communication services |
| Late, growth slowing and costs rising | Energy, materials, health care, consumer staples |
| Recession | Consumer staples, utilities, health care |
Those are tendencies, and two things limit them. You only know which phase you were in once it has ended, so the model explains better than it predicts, and plenty of rotations have nothing to do with the cycle: one rate decision, one earnings print, a shortage moving from one supplier to the next. The sector labels are also coarse. Half the market sits under Technology, which hides most of the movement inside it, so we cut the conversation into narrower rooms when we mapped a rotation in July.
What a market rotation looks like in the conversation we track
We score the conversation around stocks by who is talking and whether they have been right before, so we can watch the attention half of a rotation while it happens. One ran through AI infrastructure over the past month. We split the names into three rooms and counted mentions by week in the same rolling daily windows the app uses. Share is each room's slice of the three combined, so a quiet week does not read as a rotation on its own.
| Week | GPUs and logic | Memory and storage | GPU clouds |
|---|---|---|---|
| Aug 24 to 30 | 71.7% | 9.0% | 19.3% |
| Aug 31 to Sep 6 | 57.7% | 21.8% | 20.5% |
| Sep 7 to 13 | 33.9% | 32.3% | 33.9% |
| Sep 14 to 20 | 42.8% | 36.6% | 20.6% |
GPUs and logic is Nvidia, AMD, Broadcom and Marvell; memory and storage is Micron, SanDisk, SK hynix (both its listings counted together), Western Digital and Seagate; GPU clouds is Nebius, IREN and CoreWeave.
Count the names before you read the top-left number as anything. Nvidia reported on August 26, and Nvidia by itself accounted for 654 of the 841 chip mentions that week. The 71.7% is one earnings print, which is why a single week's share is never a rotation on its own.
What holds is the memory column: 9.0%, then 21.8%, then 32.3%, then 36.6%, four weeks in a row. It passes the breadth check too. Micron, SanDisk and SK hynix each drew more posts in the week to September 20 than in the week before it, and the distinct authors writing about the memory names rose from 51 to 95 across the same two weeks. Western Digital and Seagate stayed in single figures, which describes our coverage of those two rather than the companies.
The timing is what makes this one useful. Those rooms filled up while memory was falling. Micron closed at $1,027.77 on September 9 and $924.03 on September 14, down 10.1% in three sessions, and SanDisk fell 12.0% over the same stretch. By the Friday close on September 18 Micron was back at $1,015.80 and SanDisk above its September 9 price. The attention arrived during the drawdown rather than after the recovery. Today those three rooms read Strong on the seven-day score: Micron 79, SanDisk 79, SK hynix 82 on its US listing. The GPU clouds went the other way, peaking at 33.9% in the week to September 13 and thinning to 20.6%, with distinct authors there falling from 65 to 39.
One month is an observation rather than a method, and none of it forecasts anything. It shows where a rotation becomes visible first: in which rooms are filling, weeks ahead of the flow report that names the move. The same shift runs through our semiconductor stocks page, which carries the memory names' current scores.
How to read a rotation without chasing it
By the time a rotation is named in a headline, the first leg of it has happened. These checks are about deciding whether the next leg is worth anything to you.
- Breadth, or one name? A group that gains share because six of its companies are drawing argument has rotated. A group that gains share because one of them reported has had an earnings week. Count the names and the authors before you accept the label.
- Bullish, or only loud? Attention and approval are different readings, and the gap between them is the most useful thing on a spiking name. Volume vs signal walks through it.
- Does the score agree with the move? When mention share climbs into a group and its scores stay flat, the room arrived without a view. Attention alone gives you nothing to act on.
- What are the accounts with records doing? The leaderboard ranks the accounts whose past calls we have graded. A rotation that the graded slice leans into as hard as the wider room has more behind it than novelty. Most of the people posting are retail investors like you, which is the point of weighting them by record rather than by follower count.
- Did the business change, or only the attention? This check decides whether you act. How to research stocks is the long version and how to pick stocks the shorter one. If nothing in the filings, the guidance or the demand has moved, you are looking at a change of mood.
Treat a rotation as a sourcing tool. It points at the corner of the market worth an hour of your reading this month and says nothing about what the companies there are worth.
Check the destination before you buy it
Pick Micron, SanDisk or Nvidia and open it in Quantral. You get today's score, the calls behind it, and the record of every account that made one, bears included. It takes a minute and the trial is free.


Common questions
What is sector rotation?
Sector rotation is market rotation between industry sectors: money leaving consumer discretionary, say, and arriving in utilities and staples. It is the most-studied kind because each sector has an index and a fund to measure it with, and the business-cycle models above are built on it.
Is a rotation the same as a correction?
No. In a correction the market falls and most sectors fall with it. In a rotation the money moves sideways and the index can finish unchanged while its leadership turns over. The two run at once often enough to start arguments, because a group people are selling during a broad drawdown looks the same from the outside either way.
How long does a market rotation last?
There is no fixed length. A narrative rotation inside one theme can run its course in a couple of weeks, while a style rotation between growth and value has historically taken years to play out. Anyone who tells you the duration in advance is guessing.
Can you track market rotation with sentiment data?
You can track the attention half of it. Mention share between groups is measurable every day, well ahead of the fund-flow reports that describe the same move weeks later, which is one reason investors read alternative data sources at all. It does not measure money. People talk their way into a group without buying it, so a shift in share raises the question and the price and the filings answer it.
The bottom line
Market rotation is money changing sides inside the stock market: between sectors, between growth and value, between the biggest companies and the smallest, or between the parts of one theme. The cycle models explain the slow version well and predict it badly. The fast version shows up first in what people argue about, which is the part we measure. For a holder, the work either way is the same: find out whether the business changed before you assume the room knew something.
Mention counts and shares cover the accounts Quantral tracks in rolling 24-hour windows for the weeks named, August 24 to September 20, 2026, and are a dated snapshot. Scores are the seven-day reading as of September 21, 2026, not historical values. Prices are closing prices on the dates given. Sector-rotation frameworks are described as their authors publish them and are not predictions. Quantral surfaces signals and context from public sources to support your own research. Nothing here is financial advice or a recommendation to buy or sell. Past signals are not indicative of future results.