NVDL rose 668% in three years to Nvidia's 432%, while TSLL ended flat as Tesla nearly doubled
By Maya Koeva · October 29, 2026 · 13 min read
| What they are | ETFs that use swaps to target 2x one stock's daily return, resetting every day |
|---|---|
| Issuers | Direxion (TSLL), GraniteShares (NVDL, CONL), REX Shares with Tuttle Capital (MSTU) |
| Fees | 0.83% net (TSLL) to 1.64% net (NVDL) |
| One year to Oct 28 | NVDL fell 9.6% while Nvidia rose 7.1%; TSLL fell 48.0% while Tesla fell 12.2% |
| Reverse splits | MSTU went one-for-ten on December 3, 2025 and again on August 24, 2026 |
| Data as of | Prices October 28, 2026; mentions October 19 to 25 |
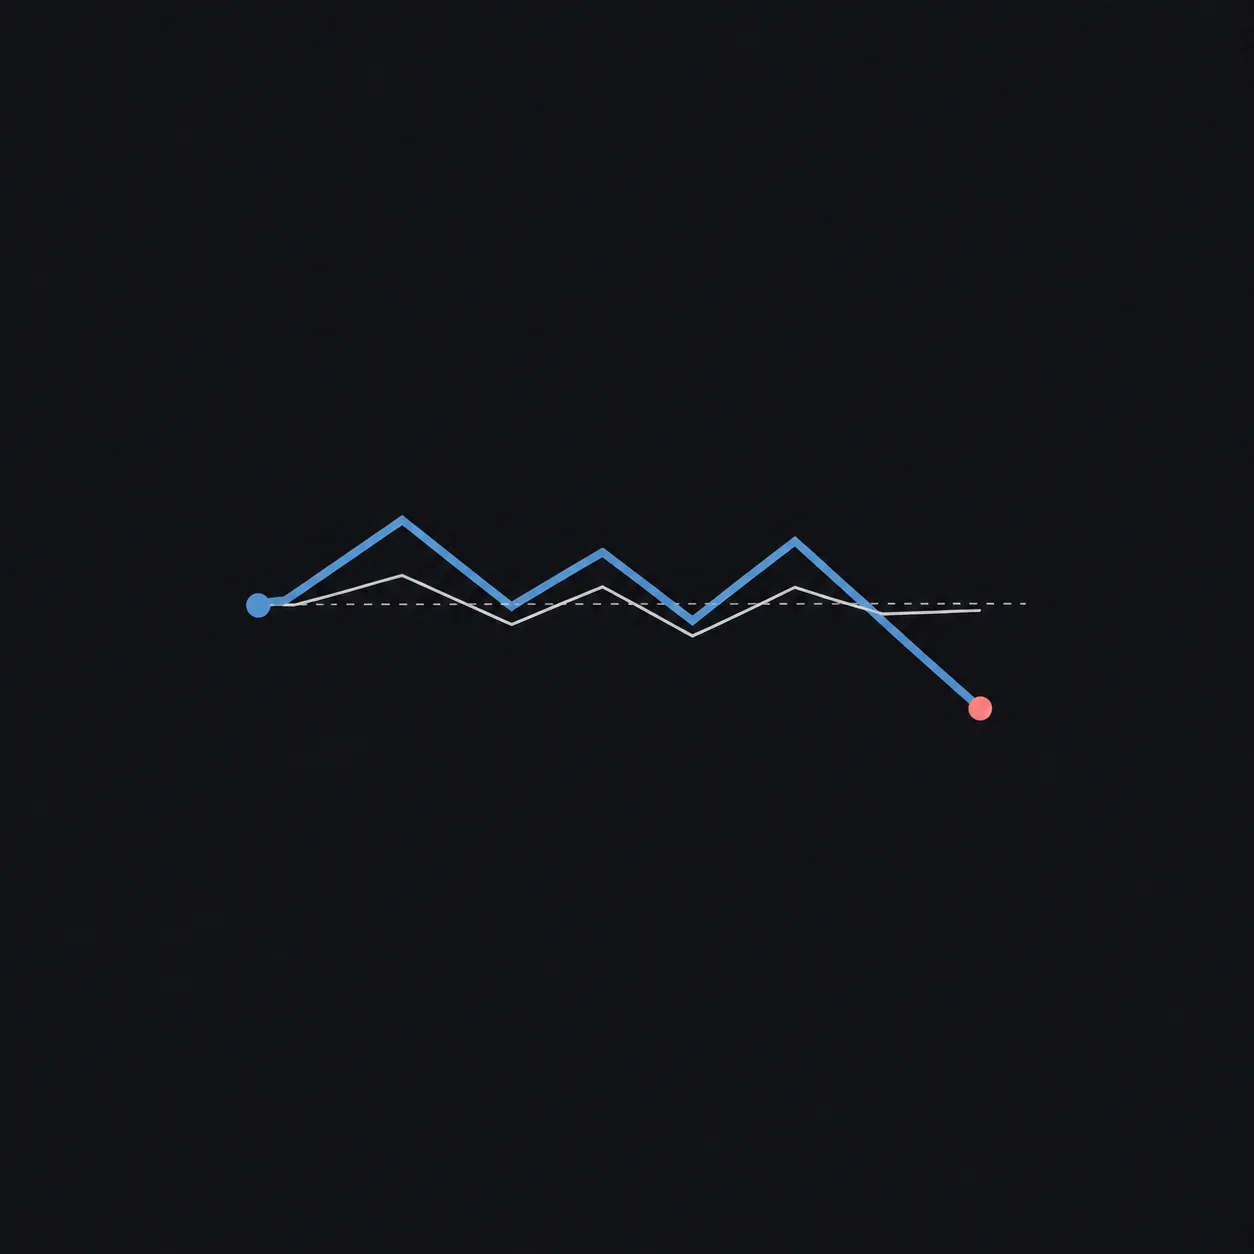
TSLL, NVDL, CONL and MSTU are single-stock leveraged ETFs. TSLL doubles Tesla's daily move, NVDL Nvidia's, CONL Coinbase's and MSTU Strategy's (MSTR). On a steady climb they can beat twice the stock: in the three years to October 28, 2026, NVDL's price rose 668% against 432% for Nvidia.
On a choppy stock they fall behind. Tesla nearly doubled over the same three years and TSLL ended 0.4% lower. In the communities we track, Nvidia's crowd leaned bullish about five to one in the week of October 19, and Tesla's leaned bearish. A 2x holder feels that direction twice.
TSLL, NVDL, CONL and MSTU compared
Each fund holds swaps worth about twice its assets on one stock, backed by cash and Treasury bills. On October 28, CONL's swaps on Coinbase came to 199.8% of the fund, per GraniteShares.
| Fund | Built on | Issuer | Launched | Net expense ratio | Close, Oct 28 | Fund, 1 year | 2x the stock | Stock, 1 year |
|---|---|---|---|---|---|---|---|---|
| TSLL | Tesla (TSLA) | Direxion | Aug 9, 2022 | 0.83% | $11.45 | 48.0% | 24.4% | 12.2% |
| NVDL | Nvidia (NVDA) | GraniteShares | Dec 13, 2022 | 1.64% | $32.15 | 9.6% | 14.2% | 7.1% |
| CONL | Coinbase (COIN) | GraniteShares | Aug 9, 2022 | 1.06% | $4.20 | 89.4% | 108.6% | 54.3% |
| MSTU | Strategy (MSTR) | REX / Tuttle | Sep 18, 2024 | 1.05% | $33.66 | 90.1% | 98.0% | 49.0% |
One year is October 28, 2025 to October 28, 2026, split-adjusted price changes. TSLL's gross expense ratio is 0.95% and NVDL's 1.65%. NVDL held $3.24 billion on October 28, MSTU $679 million on October 27 and CONL $483 million.
TSLL and NVDL did worse than twice their stock. CONL and MSTU lost about 90%, less than twice their stock's fall: as a stock slides, daily reset shrinks the fund's exposure each evening, and twice Coinbase's 54.3% drop would have been more than everything.
What daily reset means
A 2x fund promises twice the stock's return for one day, and only one day. At each close the issuer resizes the swaps so the next day starts at 2x again. After a gain, the fund adds exposure; after a loss, it cuts back.
Over a week or a year, your result depends on the path the stock took. GraniteShares says it in one line: returns over periods longer than one day will differ from 2x the stock.
Volatility decay: a worked example
Take a stock at $100 that rises 10% one day and falls 10% the next, and a 2x fund that starts at $100 beside it.
| Stock | 2x fund | Twice the stock's move | |
|---|---|---|---|
| Day 1, stock +10% | $110.00 | $120.00 | $120.00 |
| Day 2, stock -10% | $99.00 | $96.00 | $98.00 |
| 10 up-and-down pairs (20 days) | $90.44 | $66.48 | $80.88 |
| Instead: five straight +2% days | $110.41 | $121.67 | $120.82 |
The stock lost 1% over two days and the fund lost 4%, double what you would expect. Repeat the swing for a month and the stock is down 9.6% while the fund is down 33.5%. That gap is volatility decay.
The last row runs the other way. On a stock that climbs in a straight line, each day's gain compounds on a bigger base, and the fund beats twice the stock. That is how NVDL more than kept pace with Nvidia over three years. A one-day example with both long and short funds is in how daily reset works.
TSLL stock: 2x Tesla
TSLL is the Direxion Daily TSLA Bull 2X ETF, and Tesla's swings made it the clearest case of decay of the four. Tesla fell 12.2% in the year to October 28, 2026. Twice that is -24.4%; TSLL fell 48.0%. Over three years, Tesla rose 95.0% and the TSLL stock price fell 0.4%.
TSLL closed at $11.45 on October 28, 71% below its December 17, 2024 high of $40.09. It has not reverse split. Direxion charges 0.95% before a fee waiver and 0.83% after, and pays small income dividends now and then: $0.07077 a share went ex-dividend on September 22. More on the stock in our Tesla pre-earnings read.
NVDL stock: 2x Nvidia
NVDL is the GraniteShares 2x Long NVDA Daily ETF, and the one fund of the four that beat its stock over three years. Its price rose 668% in the three years to October 28, against 432% for Nvidia. GraniteShares puts its NAV total return over the same three years at 650.6%.
The last year went the other way. Nvidia rose 7.1% and the NVDL stock price fell 9.6%, to $32.15 on October 28, 25% below its May 14, 2026 high. As NVDL climbed, GraniteShares split it forward, six-for-one on March 13, 2024 and three-for-one on June 26, 2026. The fund charges 1.65% gross and 1.64% net. More in our Nvidia scorecard.
CONL stock: 2x Coinbase
CONL is the GraniteShares 2x Long COIN Daily ETF, built on the crypto exchange. Coinbase fell 54.3% in the year to October 28. CONL fell 89.4%, and the CONL stock price closed at $4.20. Over three years Coinbase rose 129% while CONL fell 54%.
CONL peaked at $85.17 on March 25, 2024 and has lost 95% since. It has not reverse split, and we found no announcement of one as of October 28. The fund charges 1.08% gross and 1.06% net.
MSTU stock and the MSTU reverse split
MSTU is the T-REX 2X Long MSTR Daily Target ETF, run by REX Shares and Tuttle Capital Management and listed on Cboe BZX (BATS: MSTU). It launched on September 18, 2024. Since then Strategy's stock has risen 9.4% and MSTU has fallen 86.8%. In the last year alone it fell 90.1% while MSTR fell 49.0%.
Adjusted for every split, MSTU peaked at $2,567 on November 20, 2024. The MSTU stock price closed at $33.66 on October 28, 2026, 98.7% lower.
| Date | Split | What it did |
|---|---|---|
| December 16, 2024 | 10-for-1 forward | Cut the price after MSTR's rally, to keep a range similar to the stock, per the fund's board |
| December 3, 2025 | 1-for-10 reverse | Lifted a price of about $1.25 to about $12.50, announced November 25 |
| August 24, 2026 | 1-for-10 reverse | Lifted a price of about $2.73 to about $27.30 |
Pre-split prices are closes the day before each split. Ten shares bought before December 2025 became one share in December and a tenth of a share in August.
Why leveraged ETFs reverse split
Decay pushes a leveraged fund's price down over time, and a reverse split pushes it back up. A one-for-ten split turns 10 shares at $2.73 into 1 share at $27.30. Your holding is worth the same the moment the split happens. The OCC adjusts listed options at the same time, so a contract keeps the same value too.
REX's December 2025 notice for MSTU gave the mechanics and no reason. At $1.25 a share, a one-cent price step is 0.8% of the price; at $12.50 it is 0.08%.
A reverse split marks how far the price has fallen, and the fund keeps its daily 2x target after it. YieldMax ran reverse splits on its income funds in December 2025 for a different reason: payouts drawn from capital.
Leveraged ETFs vs YieldMax: TSLL vs TSLY
TSLL doubles Tesla's daily move. TSLY, YieldMax's Tesla fund, sells Tesla call options and pays the premiums out every week. One magnifies the stock in both directions. The other caps the upside for income and keeps the downside.
In the year to September 30, 2026, Tesla fell 20.2%. TSLY's total return with every payment counted was -12.6%, per YieldMax. TSLL's was -54.8%, per Direxion. The same Tesla year cost a TSLL holder more than four times what it cost a TSLY holder. The YieldMax side, with payment history for TSLY, NVDY, CONY and MSTY, is in our YieldMax ETF guide.
TMF stock: 3x long-term Treasuries
TMF is the Direxion Daily 20+ Year Treasury Bull 3X ETF. It aims for three times the daily move of the ICE U.S. Treasury 20+ Year Bond Index, so it rises when long-term interest rates fall. It launched on April 16, 2009 and charges 1.01% gross and 0.90% net.
TLT, the plain 20+ year Treasury ETF, fell 12.0% in the year to October 28, 2026, and the TMF stock price fell 34.0%, to $28.94. Direxion reports a five-year NAV return of -35.45% a year to September 30. TMF reverse split one-for-ten in December 2023.
SQQQ stock price: 3x short the Nasdaq-100
SQQQ is ProShares UltraPro Short QQQ. It aims for three times the opposite of the Nasdaq-100's daily move, so it rises when the index falls. It launched on February 9, 2010, charges 0.94% and held $1.80 billion on October 28.
The Nasdaq-100 rose, so SQQQ fell. QQQ gained 14.6% in the year to October 28, 2026, and the SQQQ stock price fell 43.8%, to $36.28. ProShares has reverse split SQQQ one-for-five three times since 2022: January 13, 2022, November 2024 and November 20, 2025. A share held in 2021 is 1/125 of a share today. Its long-side sibling is covered in TQQQ: the 3x Nasdaq-100 ETF.
What the crowd says about Tesla, Nvidia, Coinbase and Strategy
The funds themselves draw few posts in the communities we track. Since October 2025, TSLL appeared in six posts, SQQQ in five, NVDL and CONL in four each and MSTU in three. The posts that did name them knew the trade. In August, one commenter worked through Tesla rising 50% one day and falling 50% the next: TSLL would double, then go to zero. In March, a trader wrote that Tesla and TSLL on margin had cost them $500,000, 30% of their portfolio, in two months of 2025.
The conversation is about the stocks. In the week of October 19 to 25 (New York dates):
| Stock | 2x fund | Mentions, 7d | Bull : Bear, 7d | Mentions, 30d | Bull : Bear, 30d |
|---|---|---|---|---|---|
| Nvidia (NVDA) | NVDL | 202 | 164 : 35 | 779 | 556 : 159 |
| Tesla (TSLA) | TSLL | 201 | 79 : 108 | 610 | 231 : 314 |
The 30-day window runs September 26 to October 25. Coinbase drew 3 mentions that week and Strategy 4, under the floor of 20 we use for a crowd read.
Nvidia's crowd leaned bullish about five to one. For an NVDL holder, a steady climb is the best case: the fund compounds past 2x, as it did from 2023 to 2026. Tesla's crowd leaned bearish, 108 to 79 in the week and 314 to 231 over 30 days. TSLL turns every Tesla drop into twice the drop, and a choppy month costs more than the chart shows.
On a 2x fund, timing counts as much as direction. Quantral grades every call it tracks, losers included, so in the app you can see which of Tesla's bulls and bears have a record worth following before you double your exposure to their view.
Common questions
What is TSLL?
TSLL is the Direxion Daily TSLA Bull 2X ETF. It aims for twice Tesla's return for a single day and resets daily. It closed at $11.45 on October 28, 2026 and charges 0.83% net.
Is TSLL a good investment?
We don't give buy or sell advice. TSLL is built for one day at a time. In the year to October 28, 2026, Tesla fell 12.2% and TSLL fell 48.0%. Over three years Tesla rose 95.0% while TSLL fell 0.4%.
Why did MSTU reverse split?
MSTU's price had fallen to about $1.25 by December 2025 and to about $2.73 by August 2026. REX ran one-for-ten reverse splits on December 3, 2025 and August 24, 2026 to lift it. A reverse split does not change what a holding is worth.
TSLL vs TSLY: what is the difference?
TSLL doubles Tesla's daily move. TSLY sells call options on Tesla and pays weekly. In the year to September 30, 2026, Tesla fell 20.2%, TSLY returned -12.6% and TSLL -54.8%.
What is CONL?
CONL is the GraniteShares 2x Long COIN Daily ETF, built on Coinbase. It closed at $4.20 on October 28, 2026, 89.4% lower than a year before.
Can you hold a leveraged ETF long term?
You can, and the issuers warn against it. Over periods longer than a day the return drifts from 2x. It drifts up on a steady trend and down on a choppy one, as NVDL and TSLL show.
Try it


Open Tesla, Nvidia or any stock behind these funds in the app, on the web at app.quantral.com, on iOS or on Android, to see its score and who made each call behind it. Start with a 7-day free trial on the yearly plan.
Fund facts are from the Direxion, GraniteShares, REX Shares and ProShares fund pages, checked on October 28 and 29, 2026. Prices and returns are split-adjusted closes from the Yahoo chart API through October 28. Split dates are from the issuers and OCC notices. Mentions are New York dates.
Quantral surfaces signals and context from public sources to support your own research. Nothing here is financial advice or a recommendation to buy or sell. Past signals are not indicative of future results.